
Ping, Traceroute and MTR: How to Find Latency and Routing Problems
Use ping to measure round-trip time and packet loss to a destination, traceroute (or tracert on Windows) to see the path and where delay appears, and mtr (or pathping on Windows) to combine both over many samples. The key skill is interpretation: loss or high latency only matters if it continues to the final hop.
Topic: Networking in IT Infrastructure · Troubleshooting
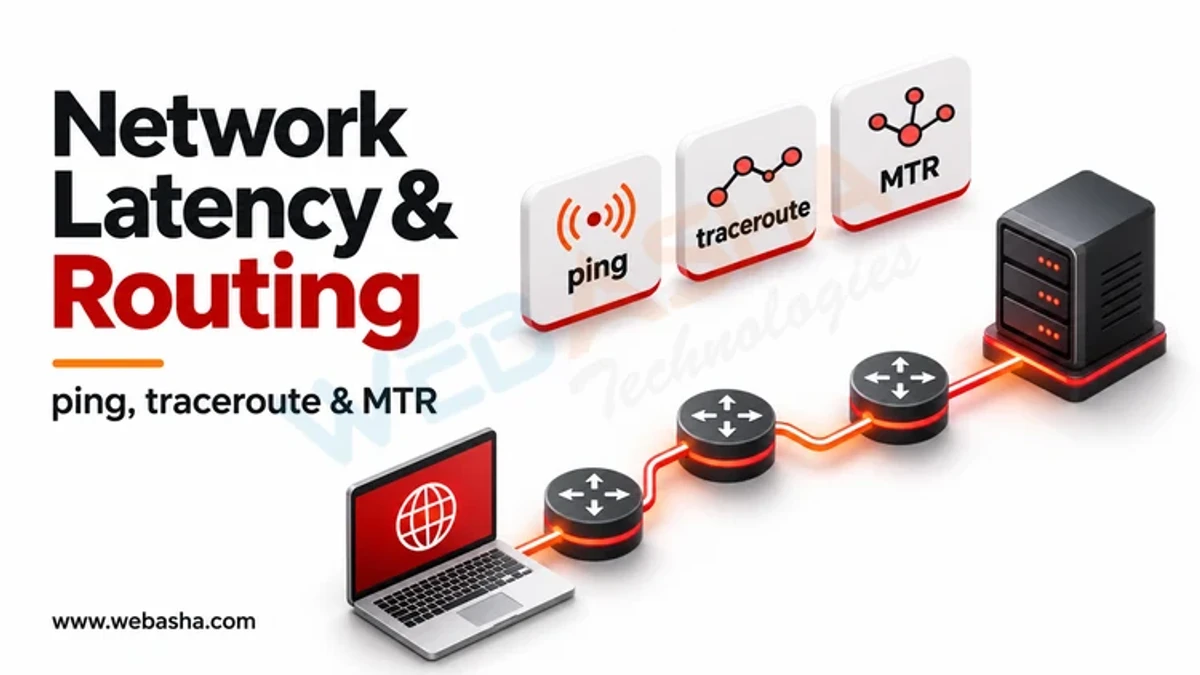
Quick answer: Use ping to measure round-trip time and packet loss to a destination, traceroute (or tracert on Windows) to see the path and where delay appears, and mtr (or pathping on Windows) to combine both over many samples. The key skill is interpretation: loss or high latency only matters if it continues to the final hop. A router in the middle that answers slowly or drops some probes is often just rate limiting ICMP, not a fault.
Key takeaways
- Ping answers "is it slow or losing packets?"; traceroute answers "where?"
- MTR sends many probes per hop, so it is better evidence than a single traceroute.
- Loss that starts at a hop and continues to the destination is real; loss at one hop only is usually not.
- Paths are often asymmetric, so the return route may be the slow one.
- Test from more than one location before blaming a provider.
Table of Contents
- What Is a Good Troubleshooting Method?
- How Do You Use Ping?
- How Does Traceroute Work?
- Why Use MTR?
- How Do You Read the Results?
- What Do Common Patterns Mean?
- What Evidence Should You Send Your ISP?
- References
What Is a Good Troubleshooting Method?
- Define the problem: which application, which destination, since when, all users or some.
- Ping your default gateway, then a public address, then the problem destination.
- Run a traceroute to the destination to see the path.
- Run MTR for a few minutes to get loss and jitter per hop.
- Repeat from another network or a cloud VM to see if the problem follows you.
How Do You Use Ping?
Ping sends ICMP Echo Request messages (RFC 792) and times the replies.
# Linux/macOS: 50 probes, summary at the end
ping -c 50 example.com

# Windows: 50 probes
ping -n 50 example.com

# Linux: test whether large packets fragment (MTU issues); 1472 + 28 header bytes = 1500
ping -M do -s 1472 example.com
Read the summary line: packet loss percentage, and min/avg/max/mdev round-trip time. A large gap between minimum and maximum, or a high mdev, indicates jitter, which hurts voice and video more than average latency does. As a rule of thumb, a wired home connection to a nearby server is often under 30 ms; to another continent, 150 ms or more is physics, not a fault.
A host that does not answer ping is not necessarily down. Many firewalls block ICMP; test the service directly with curl -I https://example.com or Test-NetConnection example.com -Port 443.
How Does Traceroute Work?
Traceroute sends packets with a Time To Live of 1, 2, 3 and so on. Each router that decrements TTL to zero drops the packet and sends back an ICMP "time exceeded" message, which reveals its address and the time taken. See the traceroute man page.
# Linux (UDP probes by default)
traceroute example.com

# Use TCP SYN to port 443 when UDP or ICMP is filtered
sudo traceroute -T -p 443 example.com

# Windows (ICMP); -d skips name lookups for speed
tracert -d example.com
Asterisks (* * *) mean that hop did not reply in time. If later hops reply, the path is fine; that router simply does not answer probes.
Why Use MTR?
MTR runs traceroute continuously and keeps statistics for each hop.
# Report mode: 100 cycles, wide output, show AS numbers, no DNS lookups
mtr -rwzbc 100 example.com

# TCP mode to port 443
sudo mtr -T -P 443 -rwc 100 example.com

# Windows equivalent: pathping (takes several minutes)
pathping -n example.com
pathping is built into Windows and reports loss per hop after its sampling period.
How Do You Read the Results?
| What you see | Meaning |
|---|---|
| Loss at one middle hop, 0% at the destination | ICMP rate limiting on that router; ignore |
| Loss starting at hop N and continuing to the end | Real loss at or just before hop N |
| Latency jumps at hop N and stays high | Long link (often a sea cable) or congestion at hop N |
| Latency spikes at one hop only | Router busy answering probes; usually harmless |
| Path ends early with stars | Firewall filtering probes; try TCP mode |
| Same IP repeating | Routing loop; report to the network owner |
What Do Common Patterns Mean?
High latency from hop 1. Your local network or Wi-Fi is the problem. Test on a cable.
Loss from hop 2 or 3. Often the ISP access network or your modem. Check line statistics and contact the ISP.
Problem appears at a peering point. Hops with different AS numbers (MTR's -z) show where traffic moves between providers. Congestion there is common at peak times and is outside your control, but your ISP can route around it.
Only one destination is slow. The problem is near that service or on its route; compare with a traceroute to a different site.
What Evidence Should You Send Your ISP?
- MTR or pathping reports in both directions if possible (ask the remote side to run one back to you).
- Times and dates of the tests, ideally both a good period and a bad one.
- Your public IP and the destination IP, not just names.
- Proof the problem occurs on a wired connection.
Related: host discovery with ICMP, TCP and UDP and hping3. For structured networking training, contact WebAsha.
References
Frequently Asked Questions
What's Your Reaction?
 Like
0
 Dislike
0
 Love
0
 Funny
0
 Wow
0
 Sad
0
 Angry
0

Vaishnavi is a skilled tech professional at the Ethical Hacking Training Institute in Pune, responsible for managing and optimizing the technical infrastructure that supports advanced cybersecurity education. With deep expertise in network security, backend operations, and system performance, she ensures that practical labs, online modules, and assessments run smoothly and securely. Her behind-the-scenes contributions play a vital role in delivering a seamless and secure learning experience for aspiring ethical hackers.