Independence Offer: Free Courses and Up to 50% on RHCSA T & E Combos!

CLAIM NOW

Grafana & Monitoring Tools

2,600+ Participants Enrolled5 Star Rating: RecommendedOverall rating: 4.9 based on 2502 reviewsG 4.9/5f 4.9/5
The Grafana & Monitoring Tools training at WebAsha Technologies in Pune is a hands-on, job-oriented observability program built on Grafana and Prometheus - the leading open-source monitoring stack.

You will master metrics and time-series data, setting up Prometheus and writing PromQL queries, building rich Grafana dashboards and visualisations, configuring alerting and notifications, log monitoring with Loki, and monitoring servers, containers and Kubernetes.

Ideal for DevOps engineers, SREs and administrators, this program builds directly employable monitoring and observability skills. WebAsha's expert trainers and real labs set you up for DevOps and SRE roles.
Duration:40 Hrs (Weekdays & Weekend Session)
Mode:Online/Classroom
Certification:WebAsha Grafana & Monitoring Certificate (Job-Oriented)
Institute:WebAsha Technologies, Pune
Includes:Hands-On Labs, Real Projects & Attendance Certificate
Trusted By

1000+ Leading Universities And Companies

Our learners are hired by the world's most respected technology, IT services and consulting brands.

  • Hiring partner
  • Hiring partner
  • Hiring partner
  • Hiring partner
  • Hiring partner
  • Hiring partner
  • Hiring partner
  • Hiring partner
  • Hiring partner
  • Hiring partner
  • Hiring partner
  • Hiring partner
  • Hiring partner
  • Hiring partner
  • Hiring partner
  • Hiring partner
  • Hiring partner
  • Hiring partner
  • Hiring partner
  • Hiring partner
  • Hiring partner
  • Hiring partner
  • Hiring partner
  • Hiring partner
  • Hiring partner
  • Hiring partner
  • Hiring partner
  • Hiring partner
  • Hiring partner
  • Hiring partner
  • Hiring partner
  • Hiring partner
  • Hiring partner
  • Hiring partner
  • Hiring partner
  • Hiring partner
  • Hiring partner
  • Hiring partner
  • Hiring partner
  • Hiring partner
  • Hiring partner
  • Hiring partner
  • Hiring partner
  • Hiring partner
  • Hiring partner
  • Hiring partner
  • Hiring partner
  • Hiring partner
  • Hiring partner
  • Hiring partner
  • Hiring partner
  • Hiring partner
  • Hiring partner
  • Hiring partner
  • Hiring partner
  • Hiring partner
  • Hiring partner
  • Hiring partner
  • Hiring partner
  • Hiring partner
  • Hiring partner
  • Hiring partner
  • Hiring partner
  • Hiring partner
  • Hiring partner
  • Hiring partner
  • Hiring partner
  • Hiring partner
  • Hiring partner
  • Hiring partner
  • Hiring partner
  • Hiring partner
  • Hiring partner
  • Hiring partner
  • Hiring partner
  • Hiring partner
  • Hiring partner
  • Hiring partner
  • Hiring partner
  • Hiring partner
  • Hiring partner
  • Hiring partner
  • Hiring partner
  • Hiring partner
Recent Placements Testimonials

Grafana & Monitoring Tools Recent Reviews

Hear directly from our learners about how the program transformed their careers.

Verified Reviews

Student Reviews & Success Stories

Real feedback from learners now placed across top technology and consulting firms.

SF

Sanjana Fernandes

Platform Engineer · DXC Technology

WebAsha's Grafana Monitoring Tools training turned a tough certification into an enjoyable learning experience. Each module built logically, and the coverage of Git, Jenkins, Docker, Kubernetes, Terraform and end-to-end CI/CD pipelines was thorough and current. I could choose between online and classroom training, and both were equally well organised. A big thank you to the trainers and team for such a rewarding learning experience.
Google Review
BG

Bhavana Gaikwad

Platform Engineer

Completing the Grafana Monitoring Tools training at WebAsha was a turning point for me. The cloud labs were available round the clock, so I could practise assignments whenever I had time. The study materials and recorded sessions were detailed and easy to revise from. I could choose between online and classroom training, and both were equally well organised. The syllabus covered Git, Jenkins, Docker, Kubernetes, Terraform and end-to-end CI/CD pipelines in real depth rather than skimming the surface. If you want practical, job-ready skills in Grafana Monitoring Tools, WebAsha is the place to be.
Verified Student
RD

Ravi Deshmukh

Platform Engineer · Accenture

I joined WebAsha for Grafana Monitoring Tools to level up my skills, and the experience exceeded my expectations. The placement assistance team actively shared openings and guided me until I was placed. What impressed me was how the trainers connected Git, Jenkins, Docker, Kubernetes, Terraform and end-to-end CI/CD pipelines to actual production use. Flexible batch timings let me attend alongside my job without any stress. I cleared the certification on my first attempt and highly recommend Grafana Monitoring Tools at WebAsha.
Verified Student
KR

Kunal Rao

DevOps Engineer · Oracle

Completing the Grafana Monitoring Tools training at WebAsha was a turning point for me. I could choose between online and classroom training, and both were equally well organised. The study materials and recorded sessions were detailed and easy to revise from. We worked hands-on with Git, Jenkins, Docker, Kubernetes, Terraform and end-to-end CI/CD pipelines, which made every concept stick. The batch was slightly large at times, yet the hands-on focus and support made it well worth it.
Google Review
RS

Rohan Sharma

DevOps Engineer

Enrolling in Grafana Monitoring Tools at WebAsha is one of the best career decisions I have made. Hands-on practice on real lab systems built genuine confidence, not just theory. The cloud labs were available round the clock, so I could practise assignments whenever I had time. The course focused on Git, Jenkins, Docker, Kubernetes, Terraform and end-to-end CI/CD pipelines through practical, real-world scenarios. This training accelerated my career growth, and I would gladly recommend it to anyone.
Google Review
SI

Sagar Iyer

Cloud Engineer · Zensar

The Grafana Monitoring Tools program at WebAsha genuinely lived up to its reputation. We worked hands-on with Git, Jenkins, Docker, Kubernetes, Terraform and end-to-end CI/CD pipelines, which made every concept stick. Doubt-clearing sessions ran even after class hours, which I really appreciated. A couple of sessions felt a little fast, but overall a strong, practical program I recommend.
Verified Student
KC

Kavita Chatterjee

Cloud Engineer · Infosys

After comparing a few institutes, I chose WebAsha for Grafana Monitoring Tools, and I am glad I did. We worked hands-on with Git, Jenkins, Docker, Kubernetes, Terraform and end-to-end CI/CD pipelines, which made every concept stick. The study materials and recorded sessions were detailed and easy to revise from. The cloud labs were available round the clock, so I could practise assignments whenever I had time. If you want practical, job-ready skills in Grafana Monitoring Tools, WebAsha is the place to be.
Facebook Review
SA

Shubham Agarwal

DevOps Engineer

Enrolling in Grafana Monitoring Tools at WebAsha is one of the best career decisions I have made. Doubt-clearing sessions ran even after class hours, which I really appreciated. Each module built logically, and the coverage of Git, Jenkins, Docker, Kubernetes, Terraform and end-to-end CI/CD pipelines was thorough and current. If you want practical, job-ready skills in Grafana Monitoring Tools, WebAsha is the place to be.
Verified Student
BB

Bhavana Bansal

Platform Engineer · Tech Mahindra

The Grafana Monitoring Tools program at WebAsha genuinely lived up to its reputation. The syllabus covered Git, Jenkins, Docker, Kubernetes, Terraform and end-to-end CI/CD pipelines in real depth rather than skimming the surface. The certification preparation and mock tests made the actual exam feel straightforward. The learning experience was structured, practical and paced just right for working professionals. Every topic was reinforced with practical lab assignments instead of just slides. The batch was slightly large at times, yet the hands-on focus and support made it well worth it.
Verified Student
KM

Karan More

SRE · Cognizant

After comparing a few institutes, I chose WebAsha for Grafana Monitoring Tools, and I am glad I did. The trainers are clearly industry experts and answered even my toughest doubts patiently. I could choose between online and classroom training, and both were equally well organised. The syllabus covered Git, Jenkins, Docker, Kubernetes, Terraform and end-to-end CI/CD pipelines in real depth rather than skimming the surface. The real-world implementation examples helped me understand how things work on the job. A couple of sessions felt a little fast, but overall a strong, practical program I recommend.
Verified Student
AP

Aniket Pathan

SRE · Wipro

Enrolling in Grafana Monitoring Tools at WebAsha is one of the best career decisions I have made. We worked hands-on with Git, Jenkins, Docker, Kubernetes, Terraform and end-to-end CI/CD pipelines, which made every concept stick. The trainers are clearly industry experts and answered even my toughest doubts patiently. Hands-on practice on real lab systems built genuine confidence, not just theory. A big thank you to the trainers and team for such a rewarding learning experience.
Verified Student
FN

Farhan Nair

DevOps Engineer · Coforge

The Grafana Monitoring Tools program at WebAsha genuinely lived up to its reputation. The real-world implementation examples helped me understand how things work on the job. The trainers are clearly industry experts and answered even my toughest doubts patiently. What impressed me was how the trainers connected Git, Jenkins, Docker, Kubernetes, Terraform and end-to-end CI/CD pipelines to actual production use. This training accelerated my career growth, and I would gladly recommend it to anyone.
Verified Student
SS

Sanjana Shaikh

DevOps Engineer

WebAsha's Grafana Monitoring Tools training turned a tough certification into an enjoyable learning experience. The learning experience was structured, practical and paced just right for working professionals. Each module built logically, and the coverage of Git, Jenkins, Docker, Kubernetes, Terraform and end-to-end CI/CD pipelines was thorough and current. I cleared the certification on my first attempt and highly recommend Grafana Monitoring Tools at WebAsha.
LinkedIn Review
SS

Sachin Shaikh

SRE

The Grafana Monitoring Tools program at WebAsha genuinely lived up to its reputation. Doubt-clearing sessions ran even after class hours, which I really appreciated. Flexible batch timings let me attend alongside my job without any stress. The syllabus covered Git, Jenkins, Docker, Kubernetes, Terraform and end-to-end CI/CD pipelines in real depth rather than skimming the surface. The real-world implementation examples helped me understand how things work on the job. The knowledge and confidence I gained here continue to help me every day at work.
Verified Student
KN

Kunal Naik

Cloud Engineer · Infosys

I joined WebAsha for Grafana Monitoring Tools to level up my skills, and the experience exceeded my expectations. What impressed me was how the trainers connected Git, Jenkins, Docker, Kubernetes, Terraform and end-to-end CI/CD pipelines to actual production use. The certification preparation and mock tests made the actual exam feel straightforward. I cleared the certification on my first attempt and highly recommend Grafana Monitoring Tools at WebAsha.
Google Review
SK

Sana Khan

Cloud Engineer · DXC Technology

After a few years as a IT Support Executive, I decided it was time for a real change and joined WebAsha's Grafana Monitoring Tools training. Cloud labs, recorded sessions and after-hours doubt support meant I could learn seriously alongside my job. Working on real-world implementations helped me understand exactly how things run on the job. Within a few months I moved from IT Support Executive to Cloud Engineer at DXC Technology, and my package grew from 3.5 LPA to 7 LPA.
Verified Student
SN

Shubham Nair

Cloud Engineer · HCLTech

After a few years as a Sales Executive, I decided it was time for a real change and joined WebAsha's Grafana Monitoring Tools training. Certification preparation, mock tests and repeated mock interviews prepared me for real technical rounds. Today I proudly work as a Cloud Engineer at HCLTech, and the jump from 3.5 LPA to 7.5 LPA still feels surreal.
Verified Student
VM

Vinay Mehta

Platform Engineer · Wipro

Coming from a BPO Executive background, switching felt risky, but WebAsha's Grafana Monitoring Tools course gave me a clear path forward. Working on real-world implementations helped me understand exactly how things run on the job. The trainers were patient and genuinely industry-experienced, and the practical focus on Git, Jenkins, Docker, Kubernetes, Terraform and end-to-end CI/CD pipelines made everything click. I landed a Platform Engineer position at Wipro with a strong hike from 4 LPA to 9.5 LPA, and I owe it to WebAsha.
Verified Student
MF

Mohit Fernandes

Cloud Engineer · TCS

I started out as a Technical Support Associate and always wanted a stronger technical career, so I enrolled in the Grafana Monitoring Tools program at WebAsha. Cloud labs, recorded sessions and after-hours doubt support meant I could learn seriously alongside my job. Certification preparation, mock tests and repeated mock interviews prepared me for real technical rounds. I landed a Cloud Engineer position at TCS with a strong hike from 4 LPA to 9 LPA, and I owe it to WebAsha.
Verified Student
AB

Akshay Banerjee

Cloud Engineer · Accenture

I started out as a Help Desk Engineer and always wanted a stronger technical career, so I enrolled in the Grafana Monitoring Tools program at WebAsha. The trainers were patient and genuinely industry-experienced, and the practical focus on Git, Jenkins, Docker, Kubernetes, Terraform and end-to-end CI/CD pipelines made everything click. I landed a Cloud Engineer position at Accenture with a strong hike from 2.4 LPA to 5 LPA, and I owe it to WebAsha.
Verified Student
SA

Shreya Agarwal

Cloud Engineer · LTIMindtree

My journey began as a IT Support Executive with big ambitions, and the Grafana Monitoring Tools program at WebAsha became the turning point. The hands-on labs and live projects around Git, Jenkins, Docker, Kubernetes, Terraform and end-to-end CI/CD pipelines rebuilt my confidence from the ground up. Working on real-world implementations helped me understand exactly how things run on the job. I landed a Cloud Engineer position at LTIMindtree with a strong hike from 4.5 LPA to 8.5 LPA, and I owe it to WebAsha.
Verified Student
AG

Arjun Gupta

SRE · Coforge

After a few years as a Fresher, I decided it was time for a real change and joined WebAsha's Grafana Monitoring Tools training. The hands-on labs and live projects around Git, Jenkins, Docker, Kubernetes, Terraform and end-to-end CI/CD pipelines rebuilt my confidence from the ground up. Cloud labs, recorded sessions and after-hours doubt support meant I could learn seriously alongside my job. I landed a SRE position at Coforge with a strong hike from 5 LPA to 11 LPA, and I owe it to WebAsha.
Verified Student
SA

Shubham Ansari

Platform Engineer · HCLTech

My journey began as a Data Entry Operator with big ambitions, and the Grafana Monitoring Tools program at WebAsha became the turning point. Working on real-world implementations helped me understand exactly how things run on the job. Certification preparation, mock tests and repeated mock interviews prepared me for real technical rounds. Within a few months I moved from Data Entry Operator to Platform Engineer at HCLTech, and my package grew from 6 LPA to 12 LPA.
Verified Student
VK

Varun Khan

Cloud Engineer · Tech Mahindra

After a few years as a Diploma Graduate, I decided it was time for a real change and joined WebAsha's Grafana Monitoring Tools training. Certification preparation, mock tests and repeated mock interviews prepared me for real technical rounds. Today I proudly work as a Cloud Engineer at Tech Mahindra, and the jump from 7 LPA to 14 LPA still feels surreal.
Verified Student
MC

Meera Chauhan

SRE · Coforge

As a Sales Executive, I felt stuck in my growth, so I took the leap and signed up for Grafana Monitoring Tools at WebAsha. The hands-on labs and live projects around Git, Jenkins, Docker, Kubernetes, Terraform and end-to-end CI/CD pipelines rebuilt my confidence from the ground up. Within a few months I moved from Sales Executive to SRE at Coforge, and my package grew from 3 LPA to 6 LPA.
Verified Student
SJ

Siddharth Joshi

DevOps Engineer · DXC Technology

My journey began as a Junior Developer with big ambitions, and the Grafana Monitoring Tools program at WebAsha became the turning point. Cloud labs, recorded sessions and after-hours doubt support meant I could learn seriously alongside my job. The trainers were patient and genuinely industry-experienced, and the practical focus on Git, Jenkins, Docker, Kubernetes, Terraform and end-to-end CI/CD pipelines made everything click. Today I proudly work as a DevOps Engineer at DXC Technology, and the jump from 4 LPA to 7.5 LPA still feels surreal.
Verified Student
SC

Sachin Chauhan

Platform Engineer · Wipro

My journey began as a Bank Employee with big ambitions, and the Grafana Monitoring Tools program at WebAsha became the turning point. The hands-on labs and live projects around Git, Jenkins, Docker, Kubernetes, Terraform and end-to-end CI/CD pipelines rebuilt my confidence from the ground up. I landed a Platform Engineer position at Wipro with a strong hike from 4 LPA to 7 LPA, and I owe it to WebAsha.
Verified Student
KK

Kiran Khan

Platform Engineer · Rakuten

My journey began as a Manual Tester with big ambitions, and the Grafana Monitoring Tools program at WebAsha became the turning point. Working on real-world implementations helped me understand exactly how things run on the job. Certification preparation, mock tests and repeated mock interviews prepared me for real technical rounds. Today I proudly work as a Platform Engineer at Rakuten, and the jump from 7 LPA to 15 LPA still feels surreal.
Verified Student
PC

Priya Chatterjee

SRE · HCLTech

After a few years as a Sales Executive, I decided it was time for a real change and joined WebAsha's Grafana Monitoring Tools training. Certification preparation, mock tests and repeated mock interviews prepared me for real technical rounds. Cloud labs, recorded sessions and after-hours doubt support meant I could learn seriously alongside my job. Today I proudly work as a SRE at HCLTech, and the jump from 3.5 LPA to 7.5 LPA still feels surreal.
Verified Student
YA

Yogesh Ansari

SRE · Rakuten

Coming from a Manual Tester background, switching felt risky, but WebAsha's Grafana Monitoring Tools course gave me a clear path forward. Cloud labs, recorded sessions and after-hours doubt support meant I could learn seriously alongside my job. The hands-on labs and live projects around Git, Jenkins, Docker, Kubernetes, Terraform and end-to-end CI/CD pipelines rebuilt my confidence from the ground up. Today I proudly work as a SRE at Rakuten, and the jump from 4.5 LPA to 9 LPA still feels surreal.
Verified Student
Career Roadmap

Your Learning To Placement Journey

A structured path that takes you from your first concept to a placed, certified professional.

Step 1 of 8

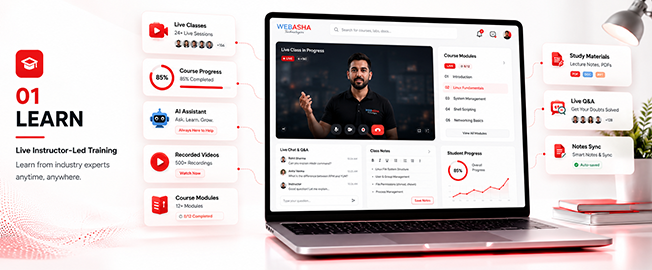
Learn

  • Live instructor-led training
  • Concept-first curriculum
  • Recorded sessions
Foundations & Core Concepts
Learn preview
Training Key Features

Grafana & Monitoring Tools Training Key Features

Explore the unique benefits of our Grafana & Monitoring Tools course — designed for foundational success and real-world, job-ready skills.

  • Post Training Support
  • Real Time Projects : 2
  • Certification & Job Assistance
  • Course Duration : 2 Months
  • Hands-on Training
  • Full Day Lab Access

Our Cloud Lab

Grafana & Monitoring Tools cloud lab environment

Our Classroom Practical Lab

Program Highlights

Discover how WebAsha Technologies empowers learners with top-notch IT training and career-ready skills.

Learning Experience
  • In-Depth Practical Training with Real-World Scenarios
  • Choose Between In-Person or Virtual Classes (Flexible Schedules)
  • Guidance from Seasoned IT Professionals
  • Complimentary Intro to Emerging Tech Topics
  • One-on-One Support for Clarifying Concepts
  • Regular Hands-On Exercises and Live Projects
  • Access to a Library of 150+ Training Videos for a Year
Career Development
  • Tailored Job Placement Support with Multiple Interviews
  • Custom Resume Crafting and Interview Coaching
  • Workshops on Professional Skills and Teamwork
  • Affordable Payment Plans with No Extra Fees
  • Help Preparing for International Certifications
  • Personal Career Guidance from Experts
  • Practice Interviews with Industry Leaders

Why Choose WebAsha Technologies

We deliver career-focused IT training that combines expert mentorship, practical learning, and globally recognized certifications to give you a competitive edge.

Features Recommended
WebAsha Technologies
Other Institutes
Expert Trainers
10+ Years Experienced Industry Professionals
Freshers or Part-time Instructors
Course Curriculum
Updated & Industry-Relevant (Cybersecurity, Cloud, DevOps, Linux, AI/ML)
Basic or Outdated Content
Hands-on Learning
Real Projects, Labs & Case Studies
Theory-Focused, Limited Practical
Certifications
Globally Recognized (EC-Council, OffSec, Red Hat, AWS, Microsoft, etc.)
Generic or Unrecognized Certificates
Placement Support
100% Assistance + Resume & Interview Coaching
Limited or No Job Support
Flexible Learning
Classroom & Online Training Options
Rigid Timings, Mostly Classroom-Only
Learning Resources
Lifetime LMS Access, Study Materials, Recorded Sessions
Minimal or No Additional Resources
Batch Size
Small Groups with 1:1 Mentorship
Large, Crowded Batches

Upcoming Batches & Schedule

Saturday, July 18, 2026

Online / Classroom
Weekend
10:00 AMIST
Enrollment OpenMax intake limit is 10

Monday, July 20, 2026

Online / Classroom
Weekday
8:00 AMIST
Enrollment OpenMax intake limit is 10

Monday, July 20, 2026

Online / Classroom
Weekday
6:30 PMIST
Enrollment OpenMax intake limit is 10

Monday, July 20, 2026

Online / Classroom
Fast Track
11:00 AMIST
Enrollment OpenMax intake limit is 10

Saturday, July 25, 2026

Online / Classroom
Weekend
10:00 AMIST
Enrollment OpenMax intake limit is 10

Monday, July 27, 2026

Online / Classroom
Weekday
8:00 AMIST
Enrollment OpenMax intake limit is 10

Monday, July 27, 2026

Online / Classroom
Weekday
6:30 PMIST
Enrollment OpenMax intake limit is 10

Monday, August 3, 2026

Online / Classroom
Weekday
8:00 AMIST
Enrollment OpenMax intake limit is 10

Monday, August 3, 2026

Online / Classroom
Weekday
6:30 PMIST
Enrollment OpenMax intake limit is 10
Flexible Scheduling

Can't Find a Schedule?

Don't worry — our counsellors will help you arrange a batch that fits your timing.

Course insight 1Course insight 2

Grafana & Monitoring Tools Course Training Overview

Build job-ready skills with our Classroom and Online Grafana & Monitoring Tools Training at WebAsha Technologies. It is hands-on, practical and focused on employability.

Training Overview:

is a hands-on, job-oriented program on observability and monitoring with Grafana and Prometheus. It covers metrics and time-series data, Prometheus setup and PromQL, building Grafana dashboards, alerting, log monitoring with Loki, and monitoring servers, containers and Kubernetes - preparing you for DevOps and SRE monitoring roles.

Intended Audience:

This course is ideal for DevOps engineers, SREs, monitoring engineers and administrators who want to build observability with Grafana and Prometheus.

Topics Covered:
  • Metrics & Time-Series: Observability basics.
  • Prometheus: Setup and scraping.
  • PromQL: Query metrics.
  • Grafana Dashboards: Visualise data.
  • Alerting: Alerts and notifications.
  • Log Monitoring: Loki and logs.
  • Exporters: Node and app exporters.
  • Monitoring K8s: Containers and Kubernetes.
Requirements:

Basic Linux and command-line familiarity is recommended. Online participants need a stable internet connection and a laptop/desktop for the live labs.

Pre-Requisites:

Basic Linux and DevOps familiarity is recommended before Grafana and monitoring training.

Career Benefits:

Observability skills are essential. In India, monitoring-skilled DevOps/SRE professionals typically earn ₹5 LPA to ₹34+ LPA.

Certification Path

CategoryTools & Components Covered
VisualisationGrafana
MetricsPrometheus
QueryPromQL
LogsLoki
ExportersNode Exporter, cAdvisor
AlertingAlertmanager
Kuberneteskube-prometheus-stack
TracingTempo (intro)

Curriculum Grafana & Monitoring Tools

Grafana & Monitoring Tools - Course Modules

1. Introduction to Observability & Metrics
  • Understand metrics and monitoring.
  • Explore the observability stack.
2. Prometheus Setup & Scraping
  • Install and configure Prometheus.
  • Scrape targets and exporters.
3. Querying with PromQL
  • Write PromQL queries.
  • Analyse metrics.
4. Building Grafana Dashboards
  • Create dashboards and panels.
  • Visualise metrics.
5. Alerting & Notifications
  • Configure alerts.
  • Route notifications with Alertmanager.
6. Log Monitoring with Loki
  • Collect and query logs.
  • Correlate logs and metrics.
7. Monitoring Servers, Containers & Kubernetes
  • Monitor hosts and containers.
  • Monitor Kubernetes.
8. Monitoring Projects
  • Build real dashboards.
  • Complete a monitoring project.

Download the Complete Course Syllabus

Get the full curriculum, modules & exam details delivered to you instantly.

Meet Our Expert Trainers

Learn from certified, industry-active Grafana & Monitoring Tools experts dedicated to practical, real-world training.

  • Simplified Guidance: Break down Linux concepts for beginners.
  • Hands-On Practice: Engage in labs for command-line and admin tasks.
  • Customized Support: Offer one-on-one help for your goals.
  • Career & Lab Aid: Assist with projects and exam prep.
  • Industry Knowledge: Draw from extensive Red Hat experience.
  • Certified Professionals: Hold RHCSA, RHCE credentials.
  • Real-World Application: Insights from enterprise Linux deployments.
  • Training Success: Over 1,000 students guided annually.
  • Corporate Links: Partnerships with IBM, Accenture, Wipro.
Free Skill Assessment

Self Assessment

Learn, grow & test your skills with an online assessment exam to achieve your certification goal.

  • Free mock test
  • Instant score report
  • Certification-aligned
Self assessment

Grafana & Monitoring Tools - Certification & Career Path

Grafana & Monitoring Tools is a hands-on, job-oriented program. This Grafana & Monitoring program is a hands-on, job-oriented course with a WebAsha completion certificate. It builds directly employable observability skills and prepares you for monitoring-focused DevOps/SRE roles and the Grafana Certified Associate certification. WebAsha Technologies in Pune adds real dashboards and placement support to launch your monitoring career.

  • Expert Trainers: Learn from experienced SRE/monitoring engineers.
  • Complete Coverage: Prometheus, PromQL, Grafana, alerting and Loki.
  • Hands-On Dashboards: Build real monitoring stacks.
  • Kubernetes Monitoring: Monitor containers and clusters.
  • Job-Oriented: Directly employable skills.
  • Flexible Batches: Weekday/weekend and online/classroom options.
  • Placement Support: Resume building and interviews.
  • Completion Certificate: WebAsha monitoring certificate.

Our Recent Certified Candidates

  • Certified candidate
  • Certified candidate
  • Certified candidate
  • Certified candidate
  • Certified candidate
  • Certified candidate
  • Certified candidate
  • Certified candidate
  • Certified candidate
  • Certified candidate
  • Certified candidate
  • Certified candidate
  • Certified candidate
  • Certified candidate
  • Certified candidate

Grafana & Monitoring Tools - Certification & Career Path

AttributeDetails
CertificateWebAsha Grafana & Monitoring Course Completion Certificate
FormatHands-on, job-oriented (labs + real dashboards)
LevelBeginner to Intermediate
Prepares ForDevOps/SRE monitoring roles and the Grafana Certified Associate path
ToolchainGrafana, Prometheus, PromQL, Loki, Alertmanager
PrerequisiteBasic Linux and DevOps familiarity
IncludesReal dashboards and placement support
ModeOnline / Classroom

Grafana & Monitoring Tools - Certification & Next Steps

This Grafana & Monitoring program is a hands-on, job-oriented course with a WebAsha completion certificate. It builds directly employable observability skills and prepares you for monitoring-focused DevOps/SRE roles and the Grafana Certified Associate certification. WebAsha Technologies in Pune adds real dashboards and placement support to launch your monitoring career.

Job Roles and Salary Outlook After Grafana & Monitoring Tools

Observability is essential to reliable systems, and monitoring-skilled DevOps and SRE professionals are in strong demand across India's IT industry.

Job Title Primary Responsibilities Average Salary (INR)
DevOps Engineer (Monitoring) Build observability. Fresher: ₹5-9 LPA
Experienced: ₹15-30 LPA
Site Reliability Engineer Ensure reliability with metrics. Fresher: ₹8-12 LPA
Experienced: ₹18-34 LPA
Monitoring Engineer Build monitoring stacks. Fresher: ₹5-9 LPA
Experienced: ₹14-28 LPA
Observability Engineer Design observability. Experienced: ₹16-32 LPA
Cloud/DevOps Engineer Monitor cloud systems. Fresher: ₹6-10 LPA
Experienced: ₹15-30 LPA
Platform Engineer Operate platforms. Experienced: ₹16-32 LPA

Salaries vary with experience and skill; Grafana & Monitoring Tools builds practical, job-ready ability.


Career Benefits of Grafana & Monitoring Tools

Grafana and monitoring skills are essential to reliable systems - building the observability that keeps DevOps and SRE teams in control.

  • Job-Oriented: Practical, employability-focused training.
  • Strong Demand: These DevOps skills are in high demand.
  • Attractive Salaries: Skilled professionals earn competitive packages.
  • Hands-On Proof: Real labs and projects.
  • Career Growth: A foundation for cloud and DevOps roles.
  • Future-Proof: DevOps demand keeps rising.

Why Choose Grafana & Monitoring Tools Training at WebAsha Technologies in Pune

Learn Grafana & Monitoring Tools with WebAsha Technologies. Our program is hands-on, job-oriented and backed by expert trainers and placement support.

  • Expert Trainers: Learn from experienced SRE/monitoring engineers.
  • Complete Coverage: Prometheus, PromQL, Grafana, alerting and Loki.
  • Hands-On Dashboards: Build real monitoring stacks.
  • Kubernetes Monitoring: Monitor containers and clusters.
  • Job-Oriented: Directly employable skills.
  • Flexible Batches: Weekday/weekend and online/classroom options.
  • Placement Support: Resume building and interviews.
  • Completion Certificate: WebAsha monitoring certificate.

Program Highlights

Why This Program Stands Out

Learning, career, certification and placement benefits — all in one program.

Learning Benefits

  • Structured Curriculum
    Concept-first, job-ready syllabus
  • Hands-On Labs
    Practice every concept live
  • Expert-Led Sessions
    Learn from working professionals

Career Benefits

  • Resume Building
    ATS-friendly, recruiter-ready
  • Mock Interviews
    Real interview simulations
  • Job Referrals
    Access to hiring partner network

Certification Benefits

  • Globally Recognized
    Industry-standard certifications
  • Exam Preparation
    Targeted, exam-focused coaching
  • Practice Tests
    Unlimited mock assessments

Placement Benefits

  • 500+ Hiring Partners
    Active recruiter network
  • Placement Drives
    Regular hiring opportunities
  • Salary Negotiation
    Guidance to maximize offers
Success Stories

Real Career Transformations

From learners to professionals at leading companies — see how careers changed.

SS

Sanjana Shaikh

DevOps Engineer

WebAsha's Grafana Monitoring Tools training turned a tough certification into an enjoyable learning experience. The learning experience was structured, practical and paced just right for working professionals. Each module built logically, and the coverage of Git, Jenkins, Docker, Kubernetes, Terraform and end-to-end CI/CD pipelines was thorough and current. I cleared the certification on my first attempt and highly recommend Grafana Monitoring Tools at WebAsha.
DevOps Certified
SK

Sana Khan

Cloud Engineer · DXC Technology

IT Support ExecutiveCloud Engineer
After a few years as a IT Support Executive, I decided it was time for a real change and joined WebAsha's Grafana Monitoring Tools training. Cloud labs, recorded sessions and after-hours doubt support meant I could learn seriously alongside my job. Working on real-world implementations helped me understand exactly how things run on the job. Within a few months I moved from IT Support Executive to Cloud Engineer at DXC Technology, and my package grew from 3.5 LPA to 7 LPA.
Cloud Engineer at DXC Technology - a career turnaround
MF

Mohit Fernandes

Cloud Engineer · TCS

Technical Support AssociateCloud Engineer
I started out as a Technical Support Associate and always wanted a stronger technical career, so I enrolled in the Grafana Monitoring Tools program at WebAsha. Cloud labs, recorded sessions and after-hours doubt support meant I could learn seriously alongside my job. Certification preparation, mock tests and repeated mock interviews prepared me for real technical rounds. I landed a Cloud Engineer position at TCS with a strong hike from 4 LPA to 9 LPA, and I owe it to WebAsha.
My journey: Technical Support Associate to Cloud Engineer
AG

Arjun Gupta

SRE · Coforge

FresherSRE
After a few years as a Fresher, I decided it was time for a real change and joined WebAsha's Grafana Monitoring Tools training. The hands-on labs and live projects around Git, Jenkins, Docker, Kubernetes, Terraform and end-to-end CI/CD pipelines rebuilt my confidence from the ground up. Cloud labs, recorded sessions and after-hours doubt support meant I could learn seriously alongside my job. I landed a SRE position at Coforge with a strong hike from 5 LPA to 11 LPA, and I owe it to WebAsha.
How I became a SRE with WebAsha
SA

Shubham Agarwal

DevOps Engineer

Enrolling in Grafana Monitoring Tools at WebAsha is one of the best career decisions I have made. Doubt-clearing sessions ran even after class hours, which I really appreciated. Each module built logically, and the coverage of Git, Jenkins, Docker, Kubernetes, Terraform and end-to-end CI/CD pipelines was thorough and current. If you want practical, job-ready skills in Grafana Monitoring Tools, WebAsha is the place to be.
DevOps Certified
KM

Karan More

SRE · Cognizant

After comparing a few institutes, I chose WebAsha for Grafana Monitoring Tools, and I am glad I did. The trainers are clearly industry experts and answered even my toughest doubts patiently. I could choose between online and classroom training, and both were equally well organised. The syllabus covered Git, Jenkins, Docker, Kubernetes, Terraform and end-to-end CI/CD pipelines in real depth rather than skimming the surface. The real-world implementation examples helped me understand how things work on the job. A couple of sessions felt a little fast, but overall a strong, practical program I recommend.
DevOps Certified
FN

Farhan Nair

DevOps Engineer · Coforge

The Grafana Monitoring Tools program at WebAsha genuinely lived up to its reputation. The real-world implementation examples helped me understand how things work on the job. The trainers are clearly industry experts and answered even my toughest doubts patiently. What impressed me was how the trainers connected Git, Jenkins, Docker, Kubernetes, Terraform and end-to-end CI/CD pipelines to actual production use. This training accelerated my career growth, and I would gladly recommend it to anyone.
DevOps Certified
SS

Sachin Shaikh

SRE

The Grafana Monitoring Tools program at WebAsha genuinely lived up to its reputation. Doubt-clearing sessions ran even after class hours, which I really appreciated. Flexible batch timings let me attend alongside my job without any stress. The syllabus covered Git, Jenkins, Docker, Kubernetes, Terraform and end-to-end CI/CD pipelines in real depth rather than skimming the surface. The real-world implementation examples helped me understand how things work on the job. The knowledge and confidence I gained here continue to help me every day at work.
DevOps Certified
SN

Shubham Nair

Cloud Engineer · HCLTech

Sales ExecutiveCloud Engineer
After a few years as a Sales Executive, I decided it was time for a real change and joined WebAsha's Grafana Monitoring Tools training. Certification preparation, mock tests and repeated mock interviews prepared me for real technical rounds. Today I proudly work as a Cloud Engineer at HCLTech, and the jump from 3.5 LPA to 7.5 LPA still feels surreal.
From Sales Executive to Cloud Engineer
Quick Summary

Grafana & Monitoring Tools is a hands-on DevOps engineering training course by WebAsha Technologies, available online and in classroom with live projects, certification prep and placement support. It suits beginners and professionals, runs about 6–12 weeks, and leads to roles such as DevOps Engineer, Site Reliability Engineer (SRE), Cloud DevOps Engineer paying roughly 5.0–28.0 LPA.

Key Takeaways

  • Master DevOps through hands-on, practical training.
  • Learn linux & scripting foundations and version control with git.
  • Work on real-world projects and lab exercises.
  • Earn an industry-recognised certificate.
  • Get placement support for roles paying up to 28.0 LPA.

Grafana & Monitoring Tools: WebAsha vs Other Options

FeatureWebAsha DevOpsSelf-studyGeneric online course
Live instructor-led trainingYesNoSometimes
Hands-on labs & real projectsYesLimitedLimited
Certification exam preparationYesSelf-managedVaries
Doubt-solving & mentorshipYesNoLimited
Placement assistanceYesNoRare
Industry-recognised certificateYesNoVaries

Last updated: 23 June 2026

Grafana & Monitoring Tools FAQs

Grafana & Monitoring Tools is a hands-on training program in DevOps engineering. It takes you from fundamentals to job-ready skills through live sessions, lab practice and real projects, with an industry-recognised certificate and placement support.

System and cloud administrators Developers moving into DevOps Freshers targeting high-paying DevOps roles IT professionals upskilling in automation

Basic Linux and command-line familiarity Interest in automation and infrastructure Programming basics are helpful, not mandatory

You will build practical skills including linux & scripting foundations, version control with git, ci/cd pipelines (jenkins, gitlab), containers with docker, orchestration with kubernetes and more, applied through hands-on labs and real projects.

The Grafana & Monitoring Tools syllabus spans DevOps engineering — from core concepts to advanced, job-ready modules, each reinforced with lab exercises and a capstone-style project.

Grafana & Monitoring Tools typically runs about 6–12 weeks depending on the track (weekday or weekend), plus lab and project time. Fast-track and extended options are available — ask for the current batch schedule.

Grafana & Monitoring Tools fees depend on the mode (classroom or live-online) and track, and WebAsha Technologies offers flexible / no-cost EMI options. Request the latest fee details and any running offers from the enquiry form.

Both. You can take Grafana & Monitoring Tools as a live-online program or attend classroom sessions, with the same syllabus, hands-on labs and trainers in either mode.

Yes. Grafana & Monitoring Tools runs in weekday, weekend and evening batches so students and working professionals can train without disturbing their schedule.

Yes. Grafana & Monitoring Tools starts from fundamentals so beginners can follow along, while the advanced modules add depth for experienced learners.

Absolutely. Many learners are working professionals — flexible weekend, evening and live-online Grafana & Monitoring Tools batches let you upskill without a career break.

Yes. Grafana & Monitoring Tools is project-driven — you practise in real labs and build live projects in DevOps engineering, not just theory, so you finish interview-ready.

After completing Grafana & Monitoring Tools you can target roles such as DevOps Engineer, Site Reliability Engineer (SRE), Cloud DevOps Engineer, Build & Release Engineer, with senior packages reaching around 28.0 LPA depending on experience and location.

Devops engineering roles typically start around 5.0 LPA for freshers and rise to about 28.0 LPA for experienced professionals. Actual packages depend on your skills, role and employer.

Yes. Devops engineering skills are in strong, growing demand across IT services, product companies and startups, offering clear career progression and rising salaries for certified professionals.

Trained DevOps professionals are hired by IT-services majors, global capability centres, product companies and startups — organisations across the industry actively recruit for DevOps engineering.

Yes. WebAsha Technologies provides resume building, mock interviews and referrals to hiring partners as part of dedicated placement support. Outcomes depend on your skills and effort.

Grafana & Monitoring Tools is taught by experienced, industry-certified trainers who bring real project experience into the classroom, so you learn current, job-relevant practices.

Yes. You receive an industry-recognised WebAsha training certificate, and the course also prepares you for the relevant official certification exam.

Yes. Alongside job skills, Grafana & Monitoring Tools includes structured exam preparation — practice tests and guidance for the recognised DevOps certification employers look for.

Yes — you can book a free demo session for Grafana & Monitoring Tools to meet the trainer and experience the teaching style before you enroll.

WebAsha combines hands-on labs, certified trainers, live projects, certification prep and dedicated placement support — a practical, job-focused path into DevOps engineering.

Click Enroll Now, request a callback, or message our team on WhatsApp to get the latest batch schedule, fees and available offers.

Keep Exploring

Related Courses

Take The Next Step In Your IT Career

Join thousands of learners who upskilled and got placed with WebAsha Technologies.